Goals and Objectives
This exercise was the culmination of the frac sand mining exercises we have been doing all semester, as well as an exercise in raster modeling. Using data we gathered in previous labs, we were to make a suitability model for frac sand mining in Trempeleau County by overlaying various raster data. We also found where high risk areas for mining were in the county.
Part 1
Methods
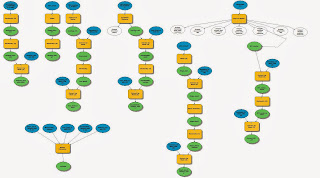 |
| Figure 1 - Work flow for part 1 |
 |
| Figure 2 - Suitable geology for frac sand mining |
For each map, we ranked suitability from 1-3, 3 being highest and 1 being lowest (or 0 being unusable) by reclassifying the raster data. For consistency, I used green for rank 3, yellow for rank 2, and red for rank 1 on all the maps.
When deciding what areas are suitable and what areas are not, it can vary from person to person. Geology, however, does not. Wonewoc and Jordan sandstone formations are suitable, so I did only one rank for that map (figure 2).
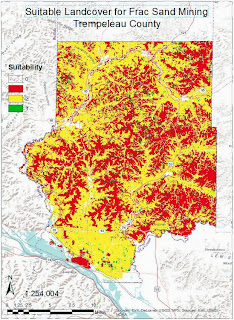 |
| Figure 3 - Suitable land cover sites |
For land cover, I ranked the suitable types by what areas were easiest to clear before mining can begin. This means that rank 3 included barren, shrub, and grass lands, Rank 2 was pasture and crop lands, and rank 1 was any type of forest land. I excluded any developed areas and wetlands entirely. Figure 3 shows the result.
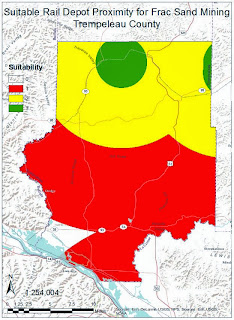 |
| Figure 4 - Suitable distance from rail depots |
Any sand mine will need a way of transporting the product, so we made a map showing suitable distance from rail depots. Rank 3 locations were any areas within 3 miles of a depot, rank 2 was between 3 and 10 miles away, and anything farther was rank 1. The map units were in meters, so I used the meter equivalent of these mile distances. To do this, I ran the 'euclidean distance' tool. Most of the maps I made only involved data that fell within our study area. However, I would think that frac mines in Trempeleau County would still be able to utilize rail depots in neighboring counties, so I included them when I ran the tool. It was only after I got the result that I used 'extract by mask' tool to show only suitable areas within our study area. I did have a mask set in the Environments menu, but it seemed to only work selectively, so I still had to run the tool occasionally. Figure 4 shows the result.
 |
| Figure 5 - Suitable slopes |
Once the sand has been mined, it must be washed to remove unwanted particles. For this reason, building a mine where the water table is close to the surface is preferable. Figure 6 shows where the water table is closest to the surface in green.
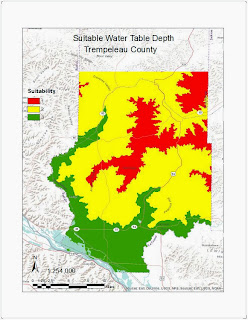 |
| Figure 6 - Suitable water table depth |
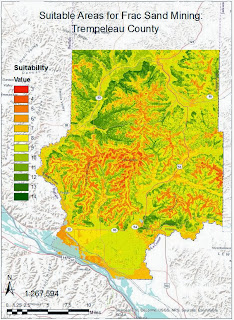 |
| Figure 7 - Part 1 suitable areas |
Results
Once I had the five separate suitability maps created, it was time to combine them to make one overall suitability map. To do this, I used the tool 'raster calculator' to add the values of all the layers. Since we used a constant suitability scale (0-3), the raster could be added together to give a range of suitability. Figure 7 shows the most suitable areas for frac sand mining in Trempeleau County, factoring in hill slope, water table depth, geology, distance from rail depots, and land cover type. As you can see in figure 7, the Northwest portion of the study area contains the most suitable areas for mining.Part 2
Methods
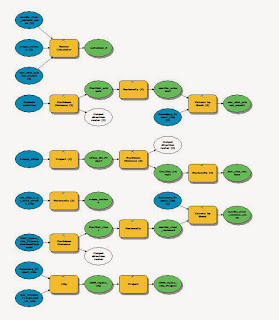 |
| Figure 8 - Work flow for part 2 |
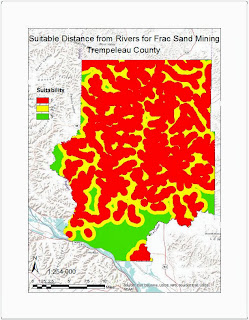 |
| Figure 9 - Suitable distance from major rivers |
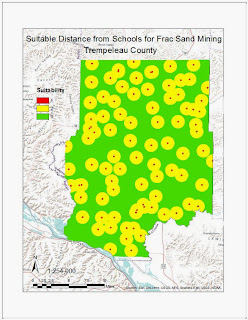 |
| Figure 10 - Risk index for area schools |
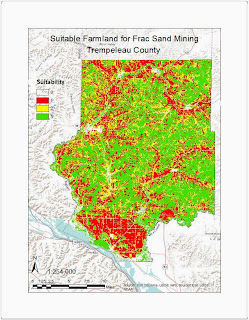 |
| Figure 11 - Risk to prime farmland from frac sand mining. |
Results
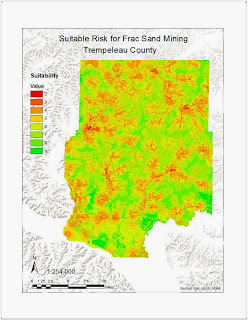 |
| Figure 12 - High-low risk areas for mining. Red represents areas of high risk, green is low risk. |
We were also tasked with using the 'viewshed' tool to find if suitable mining locations would be visible from areas of our choice. I used the campground feature class to run the tool on. In figure 13, purple denotes what is visible from these campgrounds. This is overlaid on the final suitability map made by combining the products of parts one and two. Figure 14 is the finished product.
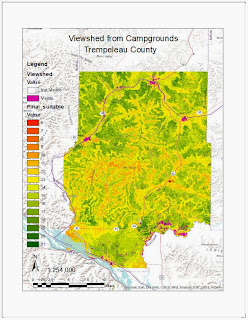 |
| Figure 13 - Viewshed of Trempeleau County campgrounds |
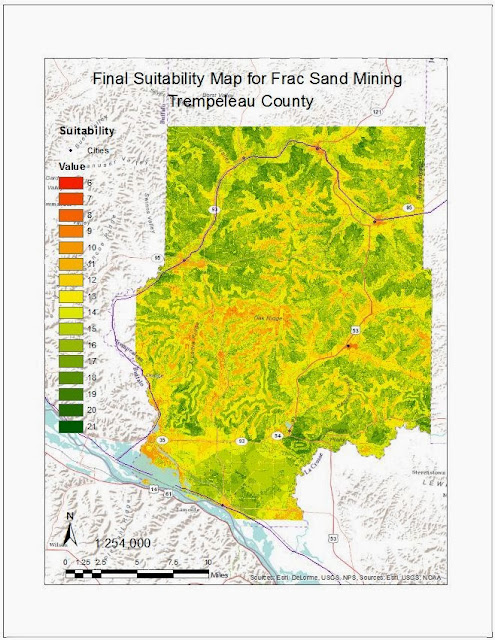 |
| Figure 14 - This map is the final suitability map for Trempeleau County including parts 1 and 2 |
Conclusion
I learned a great deal not only about using and interpreting GIS data, but also about frac sand mining during the course of this lab. Frac sand mining is a huge (and controversial) industry in Wisconsin. This was a lengthy exercise, but it tied everything we did this semester together very well. From my studies this semester, it seems that the northwestern portion of our study area would be the best place to scout new areas for frac sand mines.
No comments:
Post a Comment